How are we doing?
There’s still a lot of red on the Bounce Chart so we’re not out of the woods yet and This week is critical, with the July Producer Price Index (PPI) set to be released on Tuesday, followed by the Consumer Price Index (CPI) on Wednesday, and Retail Sales on Thursday. Futures are mixed with S&P 500 futures up 0.2%, Nasdaq 100 futures up 0.1%, and Dow futures slightly down by 0.1%. This reflects the uncertainty in the market as investors await macroeconomic indicators that could shape the Federal Reserve’s next moves.
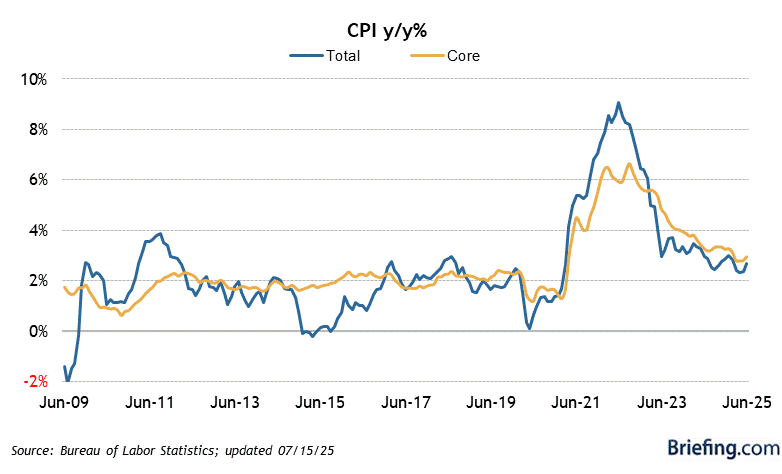
The CPI data, in particular, is under intense scrutiny. Analysts expect a modest rise in CPI of 0.2% month-over-month, but models suggest a potential miss that could affirm a disinflation trend, setting the stage for potential rate cuts by the Federal Reserve in September. If the CPI data comes in weaker than expected, this could lead to further yield curve steepening and impact the USD/JPY carry trade, with broader implications for equity markets.
Despite last week’s volatility, where fears of an impending recession weighed heavily, there is a cautious optimism in the air. UBS’ Paul Donovan noted that markets may have moved past the recent hysteria and are now focusing on economic fundamentals. However, the sentiment remains fragile, and this week’s inflation data could tip the scales either way.
Mott Capital Management has emphasized that this week could be make-or-break for the market, with CPI data likely determining the trajectory of interest rates and equity markets. A weaker-than-expected CPI could signal the beginning of a rate-cutting cycle, which would likely lead to falling rates and a weaker dollar, impacting equity markets negatively in the short term.
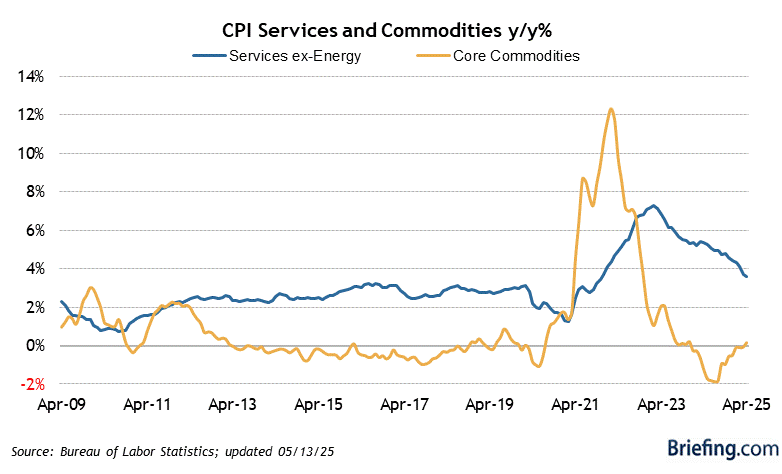
I’m not sure what people are worried about, as we’re getting CPI for July and, in July, Oil fell from $84 to $72, Coffee feel 10% as did Cotton and Sugar. Gold went up 10% but Silver fell 14% and Copper was down 15% and Hogs fell right off the table in the middle of the month – down more than 20%. Even Corn, Soybeans and Wheat got cheaper.
Of course, why guess when we have access to Super-computing AGIs, who can TELL us what is going to happen? I asked Boaty to work it out for us and he says:
🚢 To estimate July 2024 CPI, we need to make some assumptions about how these components might have changed from June to July. Based on the information provided in your initial query and the search results, we can make the following educated guesses:
-
- Energy: Likely continued its downward trend, perhaps -1.5%
- Food and Beverages: Slight moderation, perhaps +0.1%
- Housing: Typically sticky, let’s keep it at +0.2%
- Other components: Let’s assume they remained relatively stable
To estimate July 2024 CPI, we need to make some assumptions about how these components might have changed from June to July. Based on the information provided in your initial query and the search results, we can make the following educated guesses:
-
- Energy: Likely continued its downward trend, perhaps -1.5%
- Food and Beverages: Slight moderation, perhaps +0.1%
- Housing: Typically sticky, let’s keep it at +0.2%
- Other components: Let’s assume they remained relatively stable
Estimated July 2024 CPI: 314.059
Estimated monthly change: -0.037%This calculation suggests a slight decrease in CPI for July 2024, primarily driven by continued energy price declines. The 12-month change would be:
(314.059 – 304.932) / 304.932 * 100 = 2.99%
Please note that this is an estimate based on limited information and assumptions. The actual CPI could differ due to unforeseen economic factors or changes in component prices that we couldn’t account for in this calculation.
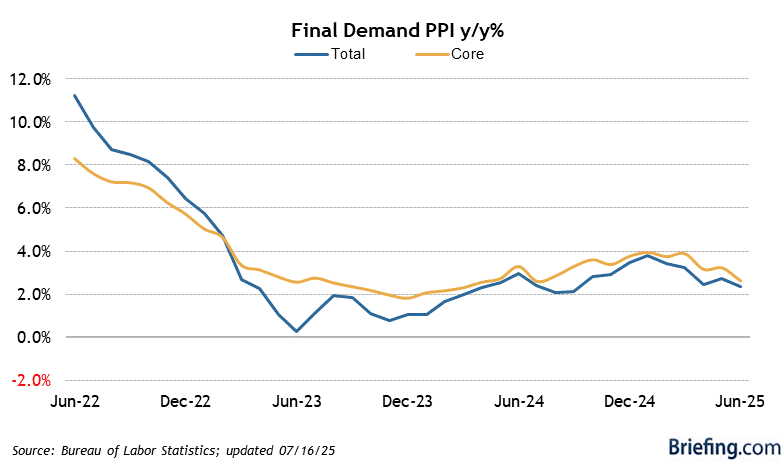
We’ll see how Boaty does on Wednesday but a drop like that could be quite a booster for rate cut rumors – and the market. Boaty also sees PPI calming down on a similar path with Energy being the major factor pulling PPI down – which will not affect the crucial core and, in fact, Boaty notes that other components are still rising slightly – indicating pressure on Corporate Margins.
The bond market is showing signs of yield curve steepening, with the spread between the 10-year and 2-year Treasury rates narrowing. This suggests that the market is pricing in a slowdown in economic growth, which aligns with the recent cooling in inflation expectations. The July jobs report, which showed a slowdown in private aggregate weekly payrolls, further supports this narrative.
The Dollar has been flat-lining at 103 since Thursday but, as we expected, that isn’t stopping the Yen from losing ground BECAUSE IT’S A DOOMED CURRENCY!!! Of course it’s DOOMED!!! – Japan is 300% of their GDP ($4Tn) in debt – that would be like us being $75Tn in debt and that won’t happen to the US ($25Tn GDP) until the end of Trump’s second term…
Of course Japan’s GDP was over $6Tn in 2010 and it’s fallen 33% in the past 14 years. If the US debt keeps growing at $2Tn a year to $64Tn in 2038 and our GDP (same aging, declining population in a country that doesn’t allow immigrants) drops to $36Tn – we will be rapidly following Japan’s path to DOOM!!! and an ultimately unsustainable economy.
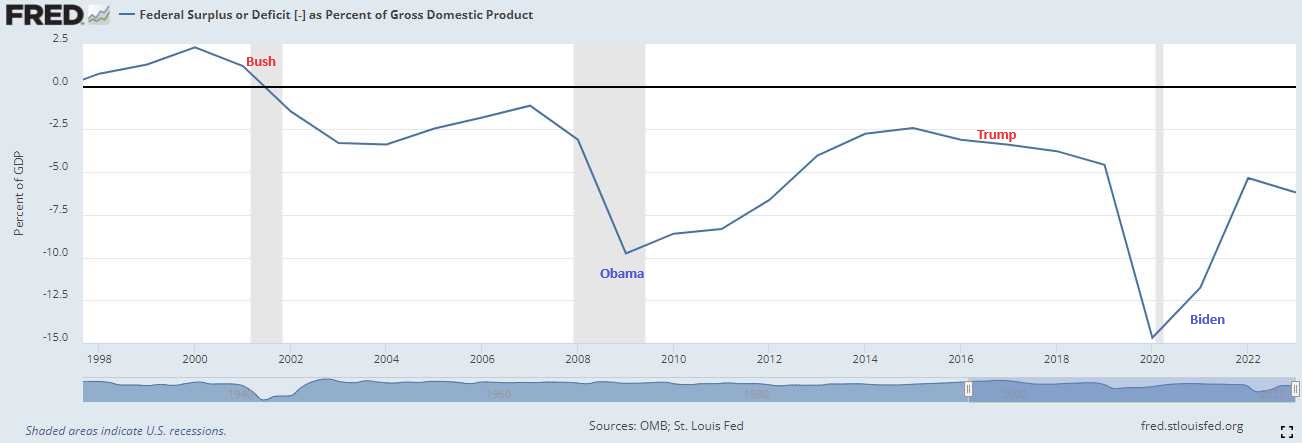
With only 14 years to go, every wrong step takes us further down the wrong path and makes it much harder to correct. A wrong Presidential term takes us 4 years down the wrong path and leaves us only 10 years to correct. When Trump was elected in 2017 – we were “only” running a Deficit that was 3.3% of our GDP but, after 4 years, by the end of 2020, our Deficit was 14.7%.

I know it’s fun to ignore FACTS and FIGURES but, people, we can’t play this game again. We’re digging ourselves into a hole that is too deep to get out of. If we can’t get back to that zero line before our Debt crosses 250% of our GDP (if even that is recoverable) – then we are going to suffer Japan’s fate and we’ll see a 10-year DECLINE in our GDP while the debts continue to climb and that pile of debt is the only thing we will be leaving for our children!
IN PROGRESS